Search Results (36)

The human factor: IT project success due to employee development
At NetLS, we turn human potential into business value through mentorship, education, and a culture of continuous growth. Discover how our people-first strategy drives innovation, loyalty, and lasting results.
 Cooperation:
1+ yr.
How test automation enabled faster releases and better quality for a telecom client
In this case study, you'll discover how we helped our long-time client from Europe develops BSS (Business Support System) solutions for communications service providers. We helped it modernize testing for its ERP product — automating complex UI and mobile workflows using a CI/CD-driven framework with Reqnroll, BDD, and Azure DevOps.

How visualized IoT data on a map improves energy management and optimizes business processes
IoT is transforming the energy industry by generating real-time data through smart sensors, helping utility companies manage assets across multiple locations. But raw data alone isn’t enough. To gain real value, businesses need clear insights — and interactive maps offer just that. By visualizing sensor data on a map, teams get a real-time, location-based view to monitor assets and respond faster to issues.
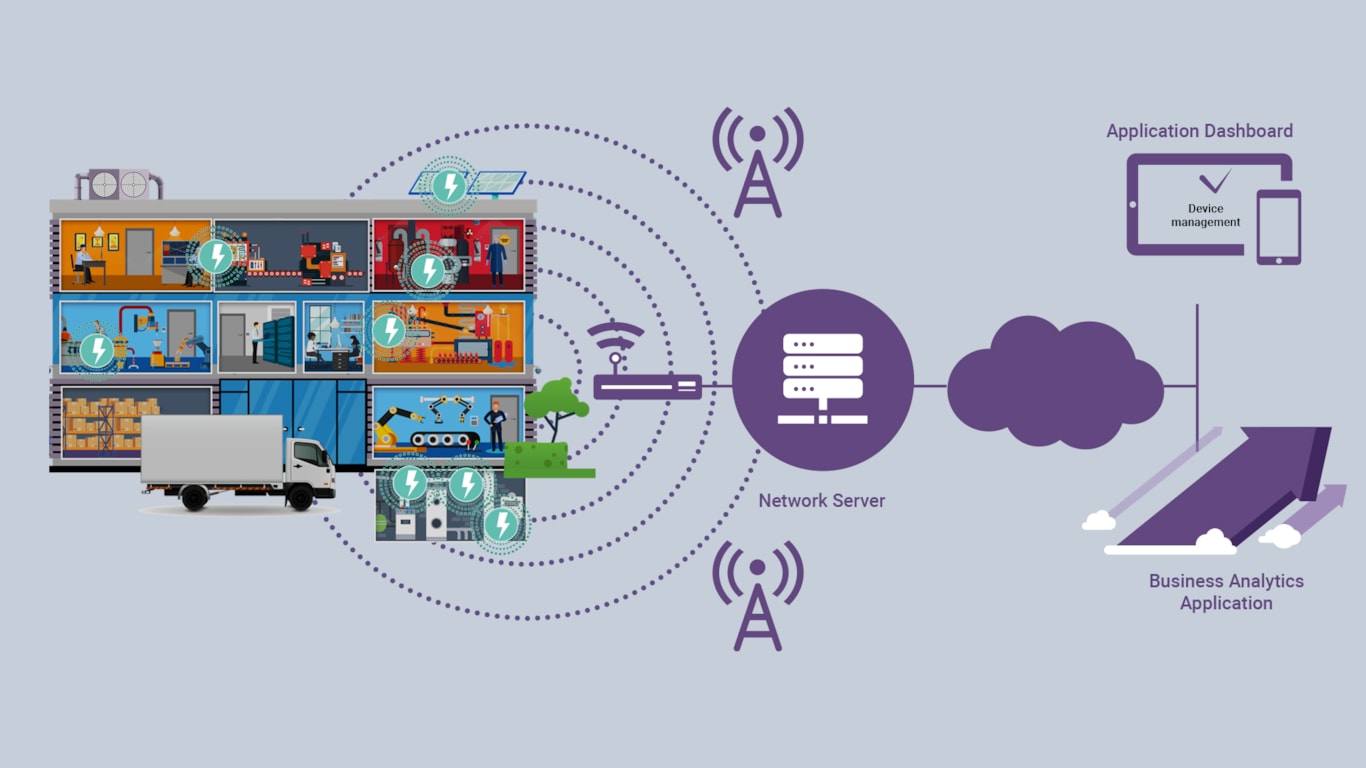
Benefits of real-time IoT-based energy analytics for business efficiency
Energy inefficiency is a major challenge for many businesses, especially with rising energy costs in Europe. Small and medium companies, lacking financial stability or dedicated energy teams, are particularly vulnerable and must optimize energy use to stay competitive. Read on to discover why IoT analytics outperforms traditional energy management and learn about its benefits through our experience with IoT energy projects.
 Cooperation:
1+ yr.
IoT data pipeline for an energy company on the Azure Cloud
To effectively help businesses optimize energy consumption, our client needed an internal system for displaying and processing IoT data for whether a block of flats or a building or a factory for better analytics, automated reporting, visualization, and actionable recommendations. Our extensive and profound technical expertise in designing innovative solutions enabled us to start working on this complex project with confidence.
 Cooperation:
2+ yrs.
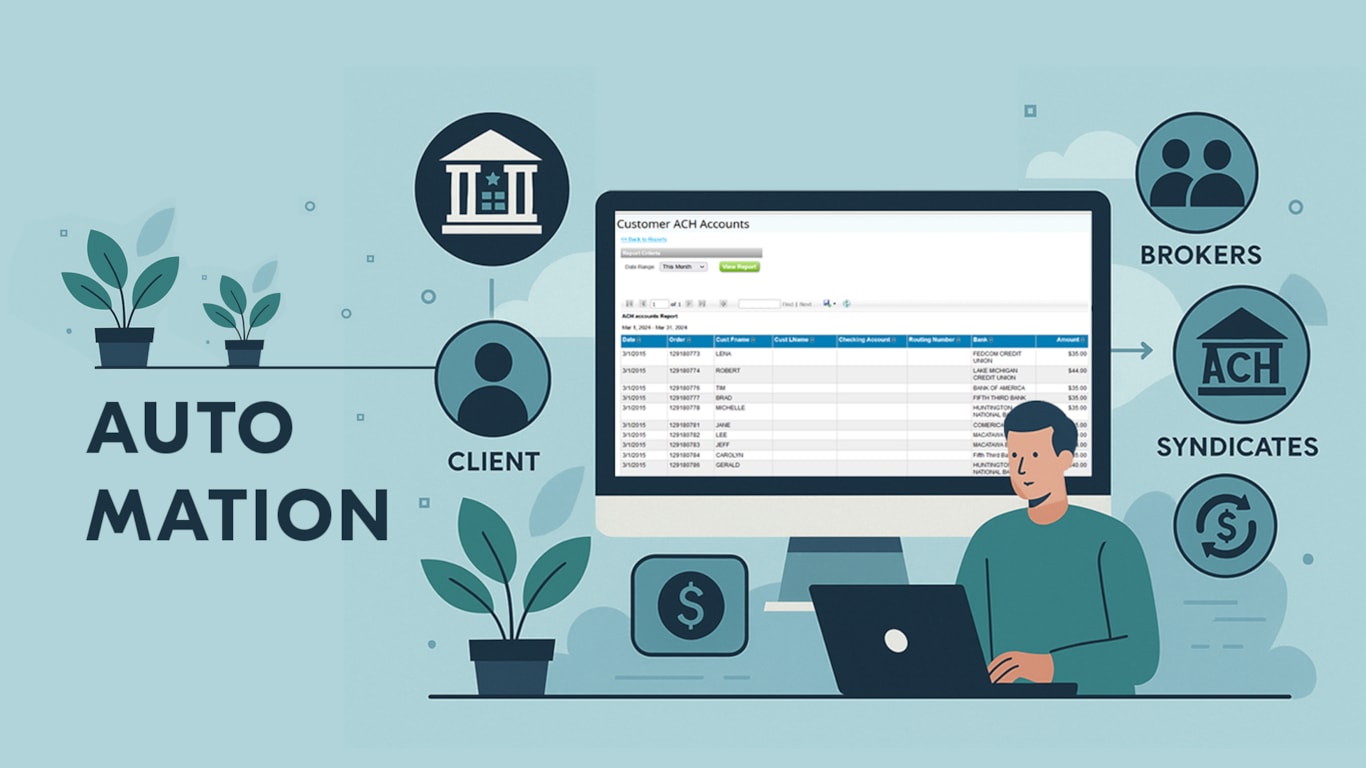
ACH payment processing system for a financial platform
We implemented a solution that supports ACH payments through the NACHA file communication protocol with a distinct logic of money distribution between the client, brokers, and syndicates.
 Cooperation:
8+ mos.
Preparing a test plan for a billing system in the telecom industry
In this case, the client needed to meet the rigorous needs of one of the largest mobile operators and internet providers in Ukraine (NDA). With a workforce of around 4,000 employees and over 27 million users nationwide, the project required careful planning at every implementation stage. To ensure superior development quality and product stability, the NetLS team designed a step-by-step test plan to coordinate testing efforts, reduce risks, and improve overall process efficiency.

Choosing the best technology for visualizing utility business entities on a map
Managing multiple assets without a unified management system inevitably leads to financial loss, delays, and disappointed clients. Today, businesses can’t afford to take such risks. So, how can they effectively overcome these challenges? Digital transformation of business operations is key in meeting today’s industry demands and staying competitive. Notably, map-based reporting has become a necessity in many areas, especially in utility services.
 Cooperation:
1+ mo.
Online map-based reporting solution for the energy sector
Our client, a company in the energy sector, owns several power plant panels on different sites and is actively expanding its facilities. The key requirement was a solution that could quickly display the status of each power plant on the interactive map. Our team immediately jumped into the process and began building the solution from scratch.
 Cooperation:
1+ mo.
Development of an effective ETL solution for efficient business management
Our client in the public sector, telecommunications domain, faced challenges in processing and analyzing large volumes of data from Telegram chats. They required a targeted search based on specific locations, keywords, and issues related to utility services. We suggested an efficient ETL solution for extracting meaningful insights from vast amounts of data across multiple chats.

Hunting Vampires at the Circus, or the Traditional Halloween 2024 at NetLS
On October 31, NetLS team was transported to another world — a realm of mysticism and mystery. The NetLS office transformed into a real haunted house, filled with an atmosphere of intrigue and fun while celebrating Halloween 2024.

Technological trends and modern practices in testing FinTech solutions
The future of financial technologies through the scope of their impact on the present. How innovative technologies in FinTech not only change the industry but also provide key tools to improve the quality and reliability of financial services through innovative approaches to testing

Summer internship in an IT company: training for students of IFNTUOG
IFNTUOG students started their internship at NetLS. By independently studying the intricacies of artificial intelligence through lectures and individual assignments, they will understand their development areas, desired professional directions, and find answers to their previous questions

The impact of different development approaches on automated testing: no-code, low-code, code
No-code - cheap price, Low-code - flexibility, Code - reliability. When to use each of the test scripting methods and what each of them offers?

Immersion in the learning process of the .NET Full-Stack Engineer Boot Camp
How studying at the Software Full Stack Engineer Boot Camp contributes to rapid team growth and cost optimization for the client. The process of training Junior Developers on a real UN-funded project
 Cooperation:
1+ mo.
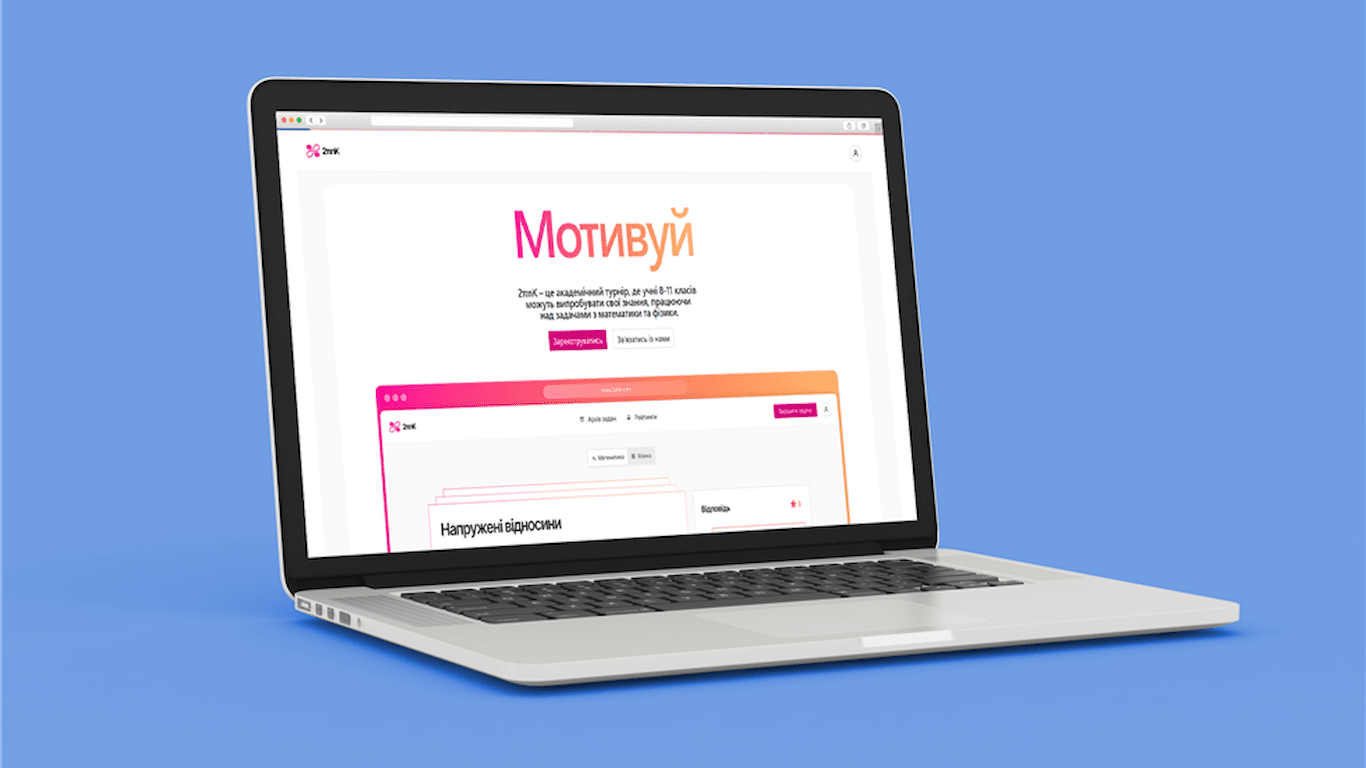
Growing of .NET specialists from scratch
Get a productive and qualified team of developers that is the cheapest on the market. After training, Software Full-Stack Engineers are ready to work on projects for our customers

Team Augmentation: New Ways to Hiring
Staff augmentation offers growth, greater scalability, agility, and involvement of specialists with a specific set of skills for a limited period. A reliable IT augmentation service provider will help to avoid possible pitfalls.
 Cooperation:
3+ yrs.
Support and improvement of the CRM system of a financial organization
The NetLS team helped the financial company eliminate critical errors, add new functionality, and ensure the stable operation of the ERP system, increasing efficiency and productivity. Now the system works smoothly and meets all standards
SHOW MORE