Background
Our client (NDA) in the public sector offers a SaaS energy management system for supervisory control across European countries. The mission is to help small and medium businesses optimize energy consumption with data-driven analytics generated from data collected via third-party devices: sensors and meters installed in the clients’ properties.
The client’s portfolio includes several tariffs for its products: apartment buildings, office facilities, and air quality sensors for public buildings. All of them must be supported by a robust system capable of handling high-frequency IoT data.
To effectively help businesses optimize energy consumption, our client needed an internal system for displaying and processing IoT data for whether a block of flats or a building, or a factory, for better analytics, automated reporting, visualization, and actionable recommendations.
Challenges in development
- Processing IoT data capable of handling large volumes of data from various sources: heat, air quality sensors, water, electricity, and more for use by a large number of users, and scanning data from a vast number of sensors distributed across Europe.
- The development environment must be flexible enough to allow switching a cloud service provider. The cloud service provider must have capabilities for automatic resource scaling and support expansion into new markets through a multi-tenant architecture approach.
- Using a globally distributed data center network provided by the cloud vendor, with response times of up to 60 ms within Europe and up to 180 ms in other regions worldwide, except Australia.
- Choosing a programming language and technologies that allow for integration with many devices in a network, using various data reading and transmission methods from the device to a data warehouse server.
- Development of a new adapter for the MQTT protocol and data conversion.
- Automated email newsletters (online and offline devices).
- Ensuring the accuracy of technical metering for clients, for the territorial agents of the listed users, with easy integration into equipment and a user-friendly interface.
Solution
Our extensive and profound technical expertise in designing innovative solutions enabled us to start working on this complex project with confidence. Once we did Product Discovery to assess the scope of work and define the objectives for the desired solution, our team started designing an internal system for displaying and processing IoT data over Azure IoT Hub.
We developed a complex data pipeline for utility monitoring. Our .NET Core solution performs raw readings from spanerse sensors and meters that pass through protocol-specific adapters. These workers route the information into both a time-series store for fast analytics and a relational database for context. Finally, the unified website UI pulls the data from both stores to display real-time dashboards, historical trends, and actionable insights.
Technology used
We enabled automated energy data processing on Azure Cloud using a modern tech stack.
Databases
The website displays the collected IoT data and integrates with two databases:
- MS SQL (relational) for establishing data relations and context.
- InfluxDB (non-relational) for storing all the sensor data.
Data processing
Workers manage continuous data flows from connected devices, while a custom-built adapter enables integration with various sensors operating on different formats and data protocols.
To support broader device compatibility, we also developed a dedicated adapter for the MQTT protocol. Thus, we enabled seamless communication with MQTT-based IoT devices. Reliable message sequencing is ensured by using RabbitMQ.
Automation
- Azure Functions execute scheduled tasks. In this case, it was important to enable email notifications to the clients on the statuses.
- Status notifications for devices (online or offline) are implemented for on-time management and maintenance.
Frontend Stack
- Angular 16-18 for fast building of scalable user and admin web interfaces of cloud solutions.
- NX caches build and test results to avoid unnecessary runs (if the code hasn’t changed, recompilation is not needed).
- Storybook for documenting and testing UI components in isolation.
Automated Testing
- Gherkin. We developed a new framework enabling TDD/BDD business scenario testing with reusable code.
Benefits
- Precise energy cost calculations for clients.
- Transparent tracking of equipment depreciation.
- Optimization of time and resources.
- Reduction in energy consumption for clients through data-driven insights.
- Improved budgeting and forecasting accuracy.
Outcomes
The client consistently delivers services to its users, thanks to the following strategic technology choices, while maintaining a scalable architecture that supports the integration of new devices and expansion into new areas:
- We chose Azure Cloud due to the presence of the Azure IoT Hub service and the control flexibility it provides, ensuring optimal cost-efficiency and security when using Azure Functions.
- The custom adapter we built makes device data usable by the system by handling both the MQTT protocol and data format conversion.
- Reliable message queue with RabbitMQ.
- Automation via Azure Functions.
- Data is stored in MS SQL and InfluxDB for performance optimization, while a modern frontend built with Angular and NX.
- Test automation with Jest, Cypress, and Gherkin improves product quality and stability.
An internal platform with IoT sensor integration for energy management collects and processes large amounts of data from different physical devices. After that, the IoT data is stored and analyzed in custom-built microservices deployed in the Microsoft Azure cloud infrastructure. These services enable automated notifications, analytical data processing, and the generation of energy efficiency recommendations.
What partnership with NetLS gave the client
With our digital transformation services, our client achieved several strategic advantages:
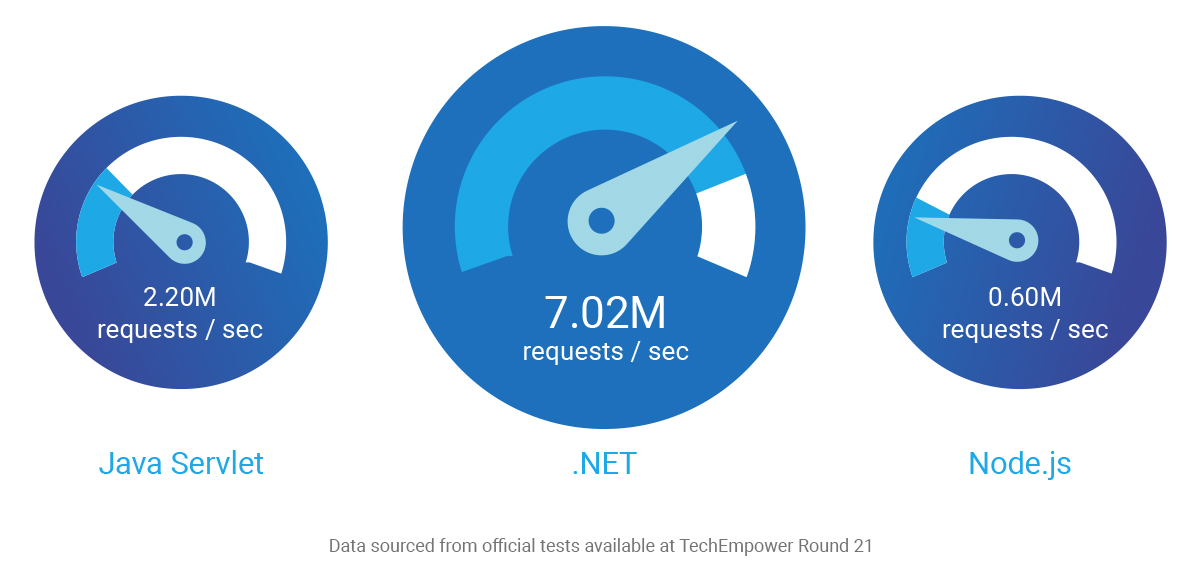
- We chose .NET Core because it’s the open-source version of ASP.NET that runs on macOS, Linux, Windows, and similar operating systems and virtual servers. We also opted for it knowing it’s a long-term support release.
- Performance is a key advantage of ASP.NET Core. It outperforms other popular web frameworks in independent benchmarks. For example, it has demonstrated stable performance, handling 7.02 million requests per second.
- Compliance with regional energy regulations and CSRD, ESG, and EU Taxonomy goals through timely energy consumption monitoring, reporting, and up-to-date inspections.
- Reduced CO2 emissions with transparent energy management.
- Scalable IoT infrastructure and automation that modernizes energy management and business processes.
- Increased productivity with automated data collection, reporting, and device monitoring to streamline workflows and reduce manual tasks.
- Competitive edge is achieved through a cloud-based, scalable Azure IoT data architecture.
- Optimized infrastructure and processes lowered IT and operational expenses.
- Improved customer engagement via real-time alerts and personalized insights.
- Revenue growth via improved service and market expansion.
- Better decision-making based on real-time IoT analytics for energy optimization via digital twins.
NetLS continues to support the energy&natural resources sector by delivering custom, cloud-based solutions that drive efficiency, scalability, and sustainability. Go to Our Pricing page, where you can learn more about our business model and book an intro call to explore how to elevate your company with better IoT data processing through modern technologies.
Yuliia Suprunenko